SalarySwishSalarySwish
Forums/Armchair-GM

elite defense core

Créé par: Wqrrior
Équipe: 2020-21 Maple Leafs de Toronto
Date de création initiale: 18 mars 2020
Publié: 18 mars 2020
Mode - plafond salarial: Basique
Signatures de joueurs autonomes
RFAANSCAP HIT
22 375 000 $
2775 000 $
2975 000 $
UFAANSCAP HIT
11 150 000 $
Transactions
1.
TOR
  1. Savard, David (2 125 000 $ retained)
  2. Choix de 4e ronde en 2021 (CBJ)
CBJ
  1. Kerfoot, Alexander
  2. Choix de 2e ronde en 2021 (TOR)
2.
NJD
  1. Dermott, Travis [Droits de RFA]
  2. Kapanen, Kasperi
  3. Choix de 2e ronde en 2022 (TOR)
Rachats de contrats
Transactions impliquant une retenue de salaire
Repêchage1e ronde2e ronde3e ronde4e ronde5e ronde6e ronde7e ronde
2020
Logo de TOR
Logo de TOR
Logo de VGK
Logo de VGK
Logo de TOR
Logo de CAR
Logo de COL
Logo de SJS
Logo de STL
Logo de WPG
2021
Logo de TOR
Logo de TOR
Logo de CBJ
Logo de TOR
Logo de TOR
Logo de TOR
2022
Logo de TOR
Logo de TOR
Logo de TOR
Logo de TOR
Logo de TOR
Logo de TOR
TAILLE DE LA FORMATIONPLAFOND SALARIALCAP HITEXCÉDENTS Info-bulleBONISESPACE SOUS LE PLAFOND SALARIAL
2385 000 000 $81 675 616 $0 $0 $3 324 384 $
Ailier gaucheCentreAilier droit
Logo de Maple Leafs de Toronto
2 250 000 $2 250 000 $
AD, AG
M-NTC
UFA - 1
Logo de Maple Leafs de Toronto
11 640 250 $11 640 250 $
C
UFA - 4
Logo de Maple Leafs de Toronto
6 962 366 $6 962 366 $
AD
UFA - 4
Logo de Maple Leafs de Toronto
821 667 $821 667 $
AG, AD
RFA - 4
Logo de Maple Leafs de Toronto
11 000 000 $11 000 000 $
C, AG
NMC
UFA - 5
Logo de Maple Leafs de Toronto
10 903 000 $10 903 000 $
AD
UFA - 5
Logo de Maple Leafs de Toronto
3 400 000 $3 400 000 $
AG, AD
UFA - 3
Logo de Maple Leafs de Toronto
2 375 000 $2 375 000 $
AG, AD
UFA - 2
Logo de Maple Leafs de Toronto
1 250 000 $1 250 000 $
AD, AG
UFA - 2
Logo de Maple Leafs de Toronto
975 000 $975 000 $
AG, AD
UFA - 1
Logo de Devils du New Jersey
2 250 000 $2 250 000 $
C, AG
UFA - 2
1 150 000 $1 150 000 $
C, AG
UFA - 1
Défenseur gaucherDéfenseur droitierGardien de but
Logo de Maple Leafs de Toronto
5 000 000 $5 000 000 $
DG
M-NTC
UFA - 2
Logo de Blue Jackets de Columbus
-1 062 500 $-1 062 500 $
DD
UFA - 1
Logo de Maple Leafs de Toronto
5 000 000 $5 000 000 $
G
M-NTC
UFA - 1
Logo de Maple Leafs de Toronto
5 625 000 $5 625 000 $
DG
NMC
UFA - 4
Logo de Devils du New Jersey
4 166 666 $4 166 666 $
DD
UFA - 3
Logo de Maple Leafs de Toronto
1 650 000 $1 650 000 $
G
UFA - 2
Logo de Maple Leafs de Toronto
894 167 $894 167 $
DG
UFA - 2
Logo de Maple Leafs de Toronto
2 000 000 $2 000 000 $
DD
M-NTC
UFA - 3
Laissés de côtéListe des blessés (IR)Liste des blessés à long terme (LTIR)
Logo de Maple Leafs de Toronto
775 000 $775 000 $
C
UFA - 1
Logo de Maple Leafs de Toronto
700 000 $700 000 $
DG
UFA - 1
Logo de Maple Leafs de Toronto
750 000 $750 000 $
DG
UFA - 1

Code d'intégration

  • Pour afficher cette équipe sur un autre site Web ou blog, ajoutez ce iFrame à la page appropriée
  • Personnalisez les dimensions dans le code IFrame ci-dessous pour adapter votre site de manière appropriée. Minimum recommandé: 400px.

Texte intégré

Cliquer pour surligner
18 mars 2020 à 19 h 5
#51
Banni
Avatar de l'utilisateur
Rejoint: juin 2019
Messages: 5,081
Mentions "j'aime": 1,433
Quoting: LeafsFanForSomeReason
The other guy showed you two different graphics, one showed that he is not good defensively, the other showed that he is good at ENTRY defense, which does not encapsulate much defensive play. I have told you that relative to his teammates, his expected goals against is low. Dallas is more likely to get scored on when he is on the ice. Some of that can be attributed to playing against top competition, but if he were a good defensive Dman, he would do good at shutting them down.

And he did do a good job because he is one of the beat defenseman at keeping top scoring chance a a lower level. Thats was shown in the other graphics and deviation is more likely attributable to luck when a goal is score of a defenseman so even then this is a poor argument against him. Like i mentioned before defensive point share is putting all defensivr stats and metrics and give the a good idea of defensive plays. But you didn’t read about did you? Because if you had you realize that it’s calculated by taking count expected goal against. For a guys who see the ice in majority off the time on penalty kill and at 5 on 5 its normal that is stats reflect like it
18 mars 2020 à 19 h 6
#52
Banni
Avatar de l'utilisateur
Rejoint: juin 2019
Messages: 5,081
Mentions "j'aime": 1,433
Quoting: Wqrrior
i can take hamonic as a comparable, as with savard and possibly manson. pesce and morrissey are a tier above IMO.

however still those guys are respected as #3/4 guys but not much more.

And that exactly where lindell is sluted. Number 3 in dallas and is use for defensive purposes mainly
18 mars 2020 à 19 h 34
#53
Avatar de l'utilisateur
Rejoint: janv. 2020
Messages: 6,808
Mentions "j'aime": 5,289
Quoting: Sebybbq
And he did do a good job because he is one of the beat defenseman at keeping top scoring chance a a lower level. Thats was shown in the other graphics and deviation is more likely attributable to luck when a goal is score of a defenseman so even then this is a poor argument against him. Like i mentioned before defensive point share is putting all defensivr stats and metrics and give the a good idea of defensive plays. But you didn’t read about did you? Because if you had you realize that it’s calculated by taking count expected goal against. For a guys who see the ice in majority off the time on penalty kill and at 5 on 5 its normal that is stats reflect like it


Actually I did read it. (Nice copy and paste from hockey reference btw) And I'm no genius, but it didn't appear to differentiate at all for strength (i.e EV, PP, PK). A good chunk of it also had to do with plus/minus, which is a pretty irrelevant stat. It also didn't mention anything about QoT, QoC, or Zone Starts. These are pretty big holes if you are trying to have an all encapsulating defensive stat. It seemed pretty flawed if you ask me. You said it takes into account all defensive metrics, but it didn't seem like it did.
18 mars 2020 à 19 h 34
#54
Sabres are elite
Avatar de l'utilisateur
Rejoint: juin 2017
Messages: 7,995
Mentions "j'aime": 3,305
Buffalo has a better D core than this...
Pharow a aimé ceci.
18 mars 2020 à 19 h 48
#55
Banni
Avatar de l'utilisateur
Rejoint: juin 2019
Messages: 5,081
Mentions "j'aime": 1,433
Quoting: LeafsFanForSomeReason
Actually I did read it. (Nice copy and paste from hockey reference btw) And I'm no genius, but it didn't appear to differentiate at all for strength (i.e EV, PP, PK). A good chunk of it also had to do with plus/minus, which is a pretty irrelevant stat. It also didn't mention anything about QoT, QoC, or Zone Starts. These are pretty big holes if you are trying to have an all encapsulating defensive stat. It seemed pretty flawed if you ask me. You said it takes into account all defensive metrics, but it didn't seem like it did.


There no stats that are a perfect reflect of a player utility but some of it show a global view. Lindell isn’t a norris winner but he is reliable on defense and there plenty of documentation and graphic that shows it. Lindell have number similar to pesce this season and everyone agree that pesce is a very great defensive defenseman. They are perfect in their respective role in third spot playing big minutes agaisnt top opponent.
18 mars 2020 à 19 h 56
#56
Avatar de l'utilisateur
Rejoint: janv. 2020
Messages: 6,808
Mentions "j'aime": 5,289
Quoting: Sebybbq
There no stats that are a perfect reflect of a player utility but some of it show a global view. Lindell isn’t a norris winner but he is reliable on defense and there plenty of documentation and graphic that shows it. Lindell have number similar to pesce this season and everyone agree that pesce is a very great defensive defenseman. They are perfect in their respective role in third spot playing big minutes agaisnt top opponent.


Where are these other documentations and graphics? I'm actually asking, not claiming that they don't exist.
18 mars 2020 à 20 h 3
#57
Just Keep Swimming
Avatar de l'utilisateur
Rejoint: juin 2018
Messages: 9,308
Mentions "j'aime": 5,649
Quoting: Sebybbq
There no stats that are a perfect reflect of a player utility but some of it show a global view. Lindell isn’t a norris winner but he is reliable on defense and there plenty of documentation and graphic that shows it. Lindell have number similar to pesce this season and everyone agree that pesce is a very great defensive defenseman. They are perfect in their respective role in third spot playing big minutes agaisnt top opponent.


Okay that is enough of this ****. I have been sitting back laughing at this thread for awhile now but this has just become too much. Lets begin with your chronic lack of understanding of any of the metrics utilised in this thread.

The first chart I posted is a RAPM regression model (regularised adjusted plus minus). It shows the total ability of a player at 5v5 both in the offensive and defensive zone and adjusts for just about everything you can think of (CoT,CoC,etc). What that chart shows is that Lindell is directly responsible for cratering his teams offence at historic levels. Not that he doesn't do anything, he makes things SOOO much worse. The defensive metrics in that chart have him at or below average defensively meaning he is directly responsible for his team being worse defensively than an average player being put out on the ice. He gives up ~ league average quality and allows the other team to massively out shoot his own compared to a league average player. He is categorically bad at both ends of the ice.

The second chart is manually tracked micro stats. This breaks down individual aspects of a game that he does or doesn't do well. He is good at breakups, but that doesn't mean he is good defensively. He is good at that one particular thing, but overall is so bad that his team gets caved in.

The stats that you are quoting are un-adjusted base stats jammed into one another, and while they are a better indicator than +/- for example, they are FAR from a good stat to model an individuals play and are 'destroyed' by even the most rudimentary regression model.

I also want to touch on the fact that you seem to be so ****ing smug about what you are saying. You are a perfect example of the dunning Krueger effect, where you know a little about a subject, but you act like your word is ****ing gospel when in reality you are basically in the same boat as an uniformed idiot. pic related:
dunning-kruger-chart.jpg

You then go on to claim that Lindell puts up similar numbers to Pesce. He does not and it isn't even close.

EFR9Nu1XUAAMVSp?format=png&name=900x900D5Mvn0EU0AIhlI-?format=png&name=900x900

Lindell is the result of old hockey thinking that is rapidly being removed from this league. His contract is terrible and he is holding his team back. I wouldn't take that contract if you offered me an unprotected 1st, and no one with an ounce of modern hockey knowledge (read analytics) would.
LeafsFanForSomeReason a aimé ceci.
18 mars 2020 à 20 h 10
#58
Avatar de l'utilisateur
Rejoint: janv. 2020
Messages: 6,808
Mentions "j'aime": 5,289
@Random2152 Thanks for being smarter than me.
18 mars 2020 à 20 h 10
#59
Banni
Avatar de l'utilisateur
Rejoint: juin 2019
Messages: 5,081
Mentions "j'aime": 1,433
Quoting: LeafsFanForSomeReason
Where are these other documentations and graphics? I'm actually asking, not claiming that they don't exist.


Go read above in that conversation! Go at rotowire and compare lindell to other defenseman like pesce or savard.
18 mars 2020 à 20 h 16
#60
Avatar de l'utilisateur
Rejoint: janv. 2020
Messages: 6,808
Mentions "j'aime": 5,289
Quoting: Sebybbq
Go read above in that conversation! Go at rotowire and compare lindell to other defenseman like pesce or savard.


There was nothing of substance in that conversation.
18 mars 2020 à 20 h 25
#61
Banni
Avatar de l'utilisateur
Rejoint: juin 2019
Messages: 5,081
Mentions "j'aime": 1,433
Quoting: Random2152
Okay that is enough of this ****. I have been sitting back laughing at this thread for awhile now but this has just become too much. Lets begin with your chronic lack of understanding of any of the metrics utilised in this thread.

The first chart I posted is a RAPM regression model (regularised adjusted plus minus). It shows the total ability of a player at 5v5 both in the offensive and defensive zone and adjusts for just about everything you can think of (CoT,CoC,etc). What that chart shows is that Lindell is directly responsible for cratering his teams offence at historic levels. Not that he doesn't do anything, he makes things SOOO much worse. The defensive metrics in that chart have him at or below average defensively meaning he is directly responsible for his team being worse defensively than an average player being put out on the ice. He gives up ~ league average quality and allows the other team to massively out shoot his own compared to a league average player. He is categorically bad at both ends of the ice.

The second chart is manually tracked micro stats. This breaks down individual aspects of a game that he does or doesn't do well. He is good at breakups, but that doesn't mean he is good defensively. He is good at that one particular thing, but overall is so bad that his team gets caved in.

The stats that you are quoting are un-adjusted base stats jammed into one another, and while they are a better indicator than +/- for example, they are FAR from a good stat to model an individuals play and are 'destroyed' by even the most rudimentary regression model.

I also want to touch on the fact that you seem to be so ****ing smug about what you are saying. You are a perfect example of the dunning Krueger effect, where you know a little about a subject, but you act like your word is ****ing gospel when in reality you are basically in the same boat as an uniformed idiot. pic related:
dunning-kruger-chart.jpg

You then go on to claim that Lindell puts up similar numbers to Pesce. He does not and it isn't even close.

EFR9Nu1XUAAMVSp?format=png&name=900x900D5Mvn0EU0AIhlI-?format=png&name=900x900

Lindell is the result of old hockey thinking that is rapidly being removed from this league. His contract is terrible and he is holding his team back. I wouldn't take that contract if you offered me an unprotected 1st, and no one with an ounce of modern hockey knowledge (read analytics) would.


And what make you think that you have the holy grails of stats. You basically brings a nice ce graphic that show exactly what i have said earlier. The only thing that this graphic show is that he doesn’t generate a lot of offense when he is on ice( what i already stated and that he have a negtive corsi but since you didn’t analize why he is in such position and you jut come out there and try to look like the next genius. Most of is assignments are in defensive zone and when they protected a leads. He play a basic game and that a direct results on possession and defensive corsi. You might think that your better then everyone but you didn’t fool me. You jist put graphic and think that people will be amazed by it but you didn’t even know what meaning they have. Now if you don’t have anythibg intelligent to bring to this conversation, you can continue your pretentious behavior elsewhere.
18 mars 2020 à 20 h 27
#62
Banni
Avatar de l'utilisateur
Rejoint: juin 2019
Messages: 5,081
Mentions "j'aime": 1,433
Modifié 18 mars 2020 à 20 h 35
Quoting: Random2152
Okay that is enough of this ****. I have been sitting back laughing at this thread for awhile now but this has just become too much. Lets begin with your chronic lack of understanding of any of the metrics utilised in this thread.

The first chart I posted is a RAPM regression model (regularised adjusted plus minus). It shows the total ability of a player at 5v5 both in the offensive and defensive zone and adjusts for just about everything you can think of (CoT,CoC,etc). What that chart shows is that Lindell is directly responsible for cratering his teams offence at historic levels. Not that he doesn't do anything, he makes things SOOO much worse. The defensive metrics in that chart have him at or below average defensively meaning he is directly responsible for his team being worse defensively than an average player being put out on the ice. He gives up ~ league average quality and allows the other team to massively out shoot his own compared to a league average player. He is categorically bad at both ends of the ice.

The second chart is manually tracked micro stats. This breaks down individual aspects of a game that he does or doesn't do well. He is good at breakups, but that doesn't mean he is good defensively. He is good at that one particular thing, but overall is so bad that his team gets caved in.

The stats that you are quoting are un-adjusted base stats jammed into one another, and while they are a better indicator than +/- for example, they are FAR from a good stat to model an individuals play and are 'destroyed' by even the most rudimentary regression model.

I also want to touch on the fact that you seem to be so ****ing smug about what you are saying. You are a perfect example of the dunning Krueger effect, where you know a little about a subject, but you act like your word is ****ing gospel when in reality you are basically in the same boat as an uniformed idiot. pic related:
dunning-kruger-chart.jpg

You then go on to claim that Lindell puts up similar numbers to Pesce. He does not and it isn't even close.

EFR9Nu1XUAAMVSp?format=png&name=900x900D5Mvn0EU0AIhlI-?format=png&name=900x900

Lindell is the result of old hockey thinking that is rapidly being removed from this league. His contract is terrible and he is holding his team back. I wouldn't take that contract if you offered me an unprotected 1st, and no one with an ounce of modern hockey knowledge (read analytics) would.


Maybe you should think for a minutes. If a players start mostly in is own zone 800 time then they have lost about 400 faceoff and that lead most of the time to a scoring chance. So that have a dirrevt affect on corsi, but as for a players who start in offensive zone like shea theodore then he benefits from the faceoff they win and that generate scoring chance. With your lovely little graphics you might want to put players who are in the same situation. A guy like theodore have started around 60% of is shift in the offensive zone compared to 45% to lindell. This is having a major impact on corsi since when your in the offensive zone you dont have to defend and usually when you have a offensive faceoof you send your best units out there. So lindell face the top opponent shift after shift, but again you thibk that your little graphics and your two or three fency words make you the reference in hockey. Maybe next time you should think twice before posting that kind of bullshat
18 mars 2020 à 20 h 29
#63
Just Keep Swimming
Avatar de l'utilisateur
Rejoint: juin 2018
Messages: 9,308
Mentions "j'aime": 5,649
Modifié 19 mars 2020 à 10 h 7 par F50marco
Quoting: Sebybbq
And what make you think that you have the holy grails of stats. You basically brings a nice ce graphic that show exactly what i have said earlier. The only thing that this graphic show is that he doesn’t generate a lot of offense when he is on ice( what i already stated and that he have a negtive corsi but since you didn’t analize why he is in such position and you jut come out there and try to look like the next genius. Most of is assignments are in defensive zone and when they protected a leads. He play a basic game and that a direct results on possession and defensive corsi. You might think that your better then everyone but you didn’t fool me. You jist put graphic and think that people will be amazed by it but you didn’t even know what meaning they have. Now if you don’t have anythibg intelligent to bring to this conversation, you can continue your pretentious behavior elsewhere.


This... This is something. Wow.
tenor.gif
@LeafsFanForSomeReason
@Wqrrior

I think this response tells you all you need to know about the convo in this thread.
LeafsFanForSomeReason a aimé ceci.
18 mars 2020 à 20 h 32
#64
Avatar de l'utilisateur
Rejoint: janv. 2020
Messages: 6,808
Mentions "j'aime": 5,289
@Random2152 Yeah... I'm having trouble believing that I actually just read that.
18 mars 2020 à 20 h 39
#65
Banni
Avatar de l'utilisateur
Rejoint: juin 2019
Messages: 5,081
Mentions "j'aime": 1,433
Modifié 19 mars 2020 à 10 h 7 par F50marco
Quoting: Random2152
This... This is something. Wow.
tenor.gif
@LeafsFanForSomeReason
@Wqrrior

I think this response tells you all you need to know about the convo in this thread.

Edit: I just realised that I am likely talking to an actual child here, so yeah that's prolly enough for me.


Quoting: Random2152
This... This is something. Wow.
tenor.gif
@LeafsFanForSomeReason
@Wqrrior

I think this response tells you all you need to know about the convo in this thread.

Edit: I just realised that I am likely talking to an actual child here, so yeah that's prolly enough for me.


Wow this is a big boy responds. Seem like your little graphics doesn’t show everything After all.
18 mars 2020 à 20 h 54
#66
Démarrer sujet
Avatar de l'utilisateur
Rejoint: févr. 2019
Messages: 10,341
Mentions "j'aime": 3,988
Quoting: Sebybbq
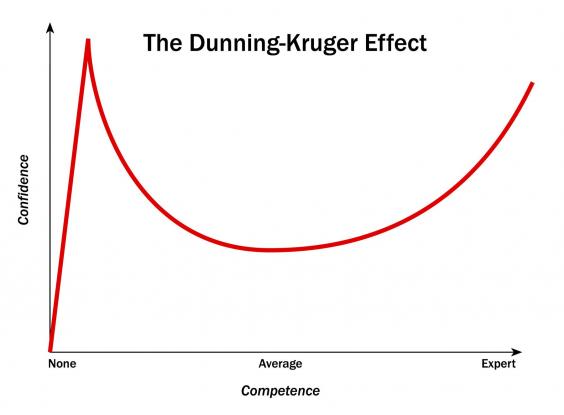
Wow this is a big boy responds. Seem like your little graphics doesn’t show everything After all. But i am not surprise at all, people of your kind have tendencies of pretentious behavior to compensate the littlest of


I must say though, that there's a reason he is on the dallas top 4. They could put anyone there in reality.

However, this guy is paid 5.8 million for 6 years.

Some similar defensemen in the 5M bracket are:

Slavin
Skjei
Rielly
Dumba
Muzzin (as of next year)
Tanev (i presume as of next year)
Lindholm
Risto
Orlov

Now, which of those would you rather on your team?
There's definitely two distinct categories - those worth their value and those not.
Ristolainen, Skjei and Lindell fall into the category of not meeting their value.
Still, they are all top 4 defensemen, but if you are paying that much money, they should be pretty balanced. Lindell is not.

You stated: " Seem like your little graphics doesn’t show everything After all."

I don't view advanced stats as the end all indicator of how good a player is, but they do give a decent indication. When somebody's stats are that bad, and compare to a guy listed as a pay-to-take contract, you know something's up.

I still think you are abnormally high on Lindell or don't really know where he falls in line. He is a lower end top 4 guy paid to be a top 2 guy. We cannot let his cap hit mask the value he actually has.
Pharow a aimé ceci.
 
Répondre
To create a post please Login or S'inscrire
Question:
Options:
Ajouter une option
Soumettre le sondage